Housing affordability is a growing concern in 2025, but new figures show there are still places where buyers get far better value for money.
Zoopla has identified towns where property prices are unusually low compared with local earnings, and the most affordable areas are found in Scotland and the north east of England.
Here’s what the data shows and why house prices have dipped.
The most affordable towns
Shildon, in the north east of England, is Great Britain’s most affordable town. Average property prices there are 1.23 times the average household income.
Last year’s most affordable town, Cumnock in Scotland, is now in second place. Its average property price is 1.25 times local household income, up from 1.1 times last year.
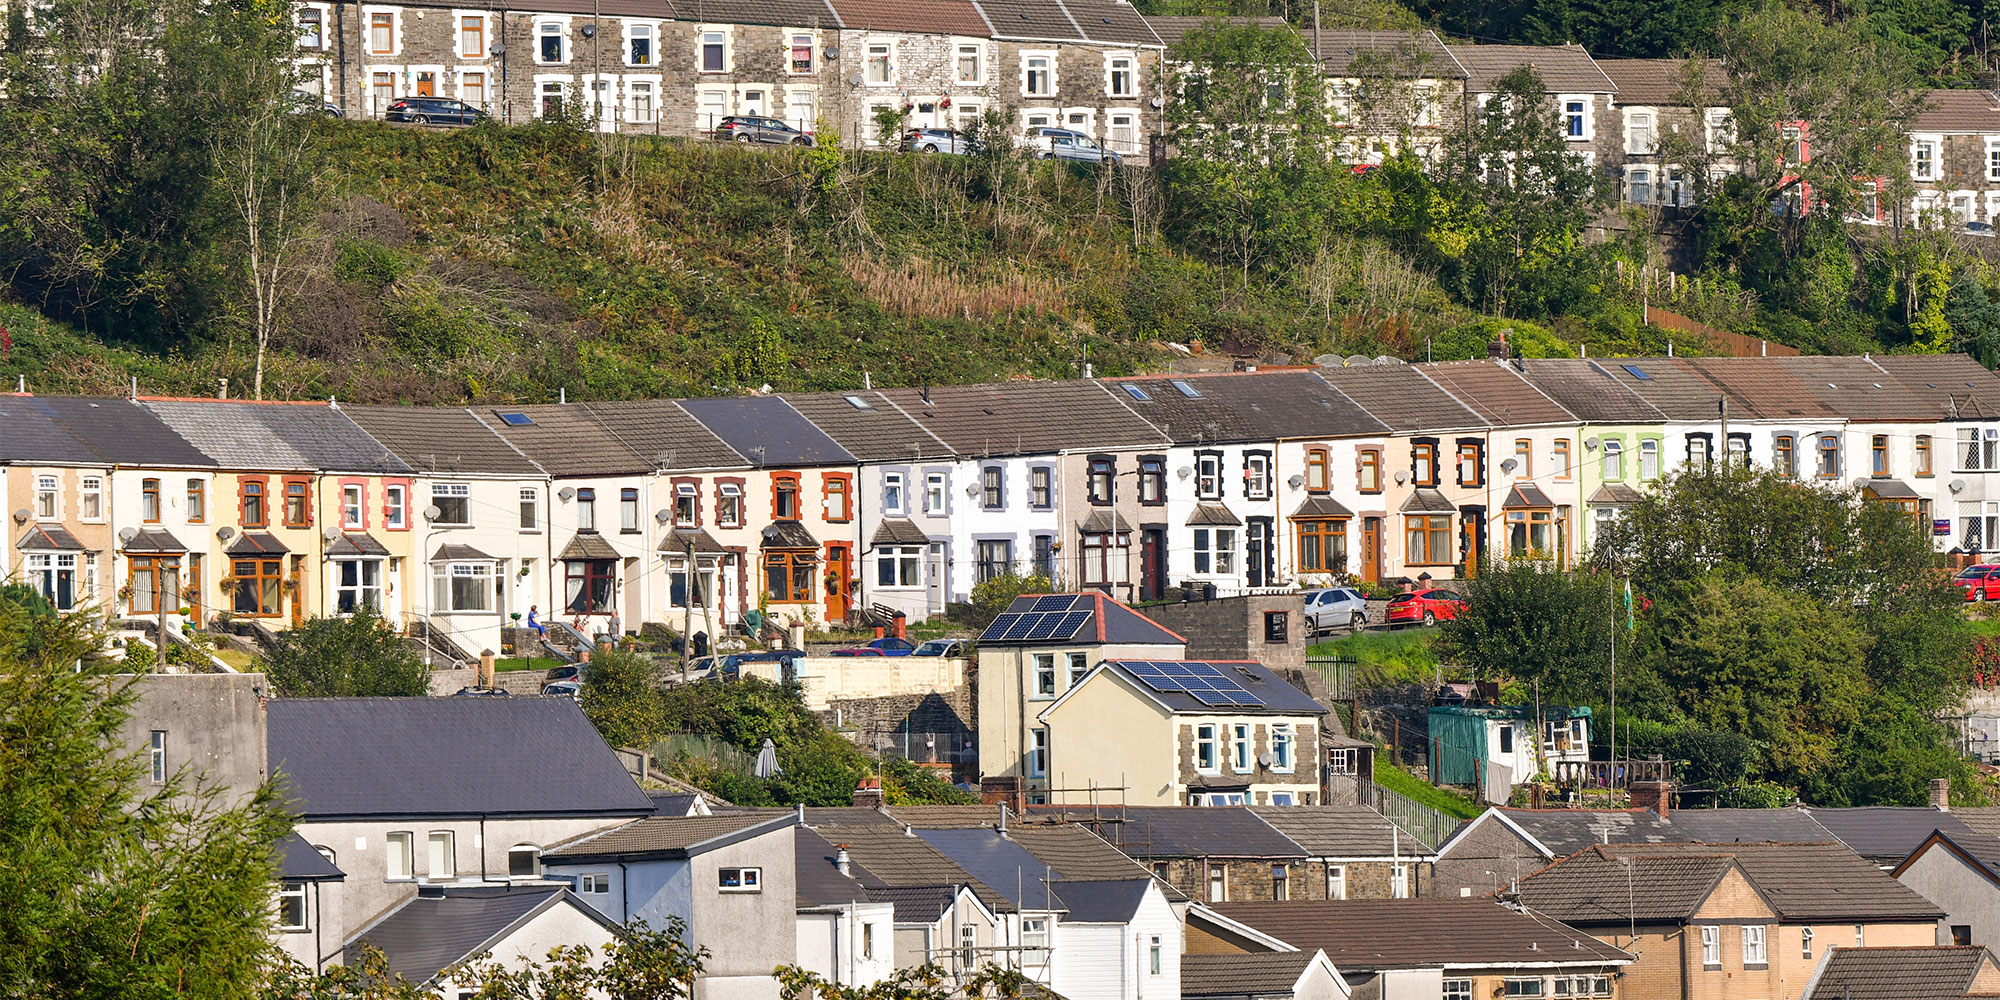
Ayrshire, in the southwest of Scotland, is home to three of the five most affordable towns in Zoopla's research: Cumnock, Saltcoats, and Ardrossan.
Ferndale in the Rhondda Valley remains the most affordable town in Wales.
How affordability differs across Great Britain
In 2025, Zoopla found that a household made up of two people earning the average full-time local salary would need 4.4 times their income to buy the average-priced home. This is a slight improvement from 4.5 times last year.
Affordability generally worsens as you move south and closer to London. The south east accounts for eight of the 10 least affordable towns; the remaining two are located in the East of England.
Beaconsfield in Buckinghamshire is the least affordable town in Great Britain. House prices there are more than 15 times average household earnings, and the median home is valued at £1.1 million.
The table below lists the most affordable town or city in each region of Great Britain.
The London areas offering better value
Even the most affordable part of London sits above the national average. Tower Hamlets has a house-price-to-earnings ratio of just over five.
Across the 10 most affordable London boroughs, average house prices range from 4.97 to 6.12 times typical household income.
Zoopla notes that outer London boroughs are usually more affordable, although Tower Hamlets, Southwark and Lambeth are exceptions. It links this to higher average earnings in these areas and a greater supply of flats.
The single tax
Zoopla’s analysis assumes two full-time incomes per household, so single buyers face far tougher conditions.
A single buyer would need around 8.8 times their annual income to purchase a home.
Government figures show that 26% of first-time buyers are single.
Why have house prices dipped?
Land Registry data for September shows a 0.6% monthly fall in house prices. As this is based on actual sale prices, it provides the most accurate picture of the market.
Prices are still rising annually, with a 2.6% year-on-year increase. More data over the coming months will show whether September marks a wider trend or a one-off dip.
Other indices also point to softening prices. Rightmove, which tracks asking prices, links the fall to a decade-high number of homes on the market and the later-than-usual Autumn Budget.
Rightmove also reports that one in three listed homes has had its asking price reduced, adding pressure to sellers.
The market may pick up if the Budget is well received and interest rates are cut in December.
Advice on buying a house
Here at Which? we've got you covered. Whether you're about to start viewing properties or are in the process of saving for a deposit, we’re here to help.
For those looking for a mortgage, we've found the best mortgage lenders and reviewed over 20 mortgage lenders. We also spotlight the top mortgage rates, which are updated daily.
To ensure nothing gets missed before the big move, we also have a moving house checklist.


